

Free Tables, Charts and Diagrams Practice
Twelve questions, one from every skill the data handling lessons teach, at three levels of difficulty. Every chart, table and diagram is drawn fresh, so the reading is real. Tap a card to check the answer, and press New questions whenever you want a new set.
Want the method behind the questions? Tables, Charts & Diagrams Bundle teaches every lesson these twelve are drawn from, with the same click to reveal answers.
See the bundle · £19.99Got all twelve? Level 2, building up keeps the same twelve skills and makes every one of them harder.
Step up to level 2
5 lessons · 29 units · 408 questions
Get the bundle · £19.99£29.95 if you buy them one at a time, so the bundle saves £9.96. Every lesson is also sold on its own.
Whichever question they stall on names the lesson
The twelve questions above are drawn one skill at a time from these five lessons, which climb from counting a tally to reading a pie chart and working back from its angles. Each one teaches the method first, clicking through a worked example line by line, then works up through practice to a challenge.
Question numbers mean the same thing at every level, so whichever one your child stalls on names the lesson to work on next, whether they stalled at level 1 or level 3.
 Q1 to Q3
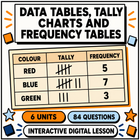
Data Tables, Tally Charts & Frequency Tables
Stuck counting a tally, or on the totals of a frequency table?
6 units, 84 questions · £5.99
View lesson →
Q1 to Q3
Data Tables, Tally Charts & Frequency Tables
Stuck counting a tally, or on the totals of a frequency table?
6 units, 84 questions · £5.99
View lesson →
 Q4 to Q6
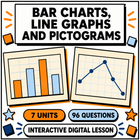
Bar Charts, Line Graphs & Pictograms
Stuck reading a bar off a scale, a pictogram key, or a line graph?
7 units, 96 questions · £5.99
View lesson →
Q4 to Q6
Bar Charts, Line Graphs & Pictograms
Stuck reading a bar off a scale, a pictogram key, or a line graph?
7 units, 96 questions · £5.99
View lesson →
 Q7 to Q8
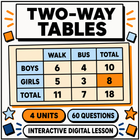
Two-Way Tables
Stuck reading a two-way table, or filling a gap in one?
4 units, 60 questions · £5.99
View lesson →
Q7 to Q8
Two-Way Tables
Stuck reading a two-way table, or filling a gap in one?
4 units, 60 questions · £5.99
View lesson →
 Q9 to Q10
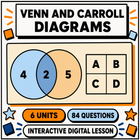
Venn Diagrams & Carroll Diagrams
Stuck on which region of a Venn is which, or on sorting into a Carroll diagram?
6 units, 84 questions · £5.99
View lesson →
Q9 to Q10
Venn Diagrams & Carroll Diagrams
Stuck on which region of a Venn is which, or on sorting into a Carroll diagram?
6 units, 84 questions · £5.99
View lesson →
 Q11 to Q12
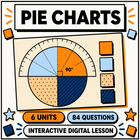
Pie Charts
Stuck turning a pie chart angle into a number of people, or the other way round?
6 units, 84 questions · £5.99
View lesson →
Q11 to Q12
Pie Charts
Stuck turning a pie chart angle into a number of people, or the other way round?
6 units, 84 questions · £5.99
View lesson →
Delivered as a link by email, works on a phone, tablet or laptop, and it is yours to keep. Or browse all mastery lessons.
More free practice
Same idea, different topic. Every set is free, gives instant answers and regenerates.